Desafio #3: Gráfico Temático Star Wars

Tópico reservado para postar resoluções do Desafio #3: Gráfico Temático Star Wars

E aqui vai o primeiro desafio de visualização da Curso-R!

O objetivo desse desafio é escrever um código que reproduza o seguinte gráfico:

Você pode ler mais informações sobre o desafio no post do blog

3 curtidas

Oi gente tudo bem?
Postando minha resolução para o desafio.

Eu tive problemas durante a importação da fonte para meu PC, ai usei uma solução que vi nesse issue "No FontName. Skipping" during font_import() · Issue #32 · wch/extrafont · GitHub. Reparei que não funcionou para a galera do Mac :frowning:

# Desafio 3 ---------------------------------------------------------------
install.packages("dados")
install.packages("extrafont")
data <- dados::dados_starwars

#pacotes
library(tidyverse)
library(magick)
library(cowplot)
library(extrafont)

#Tive problemas para importar a fonte no meu PC então utilizei essa solução
remotes::install_version("Rttf2pt1", version = "1.3.8")

extrafont::font_import()
loadfonts(device = "win")
fonts()

glimpse(data)

theme_set(theme_cowplot())

p1 <- data %>% 
  ggplot(aes(x = massa, y = altura)) +
  geom_point(size = 1.5,
             shape = 23, fill = "yellow",
             alpha = .8, color = "yellow") +
  xlim(c(0,200)) +
  #Escolhendo apenas Darth Vader para destacar
  geom_point(data = filter(data, nome == "Darth Vader"),
             shape = 23, fill = "red",
             size = 1.5,alpha = .8, color = "red")+
  geom_label(data = filter(data, nome == "Darth Vader"),
             aes(label = "darth vader"), #Devido a fonte
             fill = "red",
             nudge_x = -10,
             nudge_y = 10, family = "Star Jedi") +
  #Titulo e subtitulo
  ggtitle(label = "STAR WARS",subtitle = "may the force be with you") +
  #Elementos do tema
  theme(text = element_text(family = "Star Jedi",
                            colour = "yellow"),
        plot.title = element_text(family = "Star Jedi",
                                 colour = "yellow",hjust = .5),
        plot.subtitle = element_text(family = "Star Jedi",
                                     colour = "yellow",hjust = .5),
        axis.line = element_blank(),
        axis.ticks = element_blank(),
        axis.text = element_text(family = "Star Jedi",
                                 colour = "yellow"))


p1

final <- ggdraw() +
  draw_image(image = "Desafio2/11836.png") +
  draw_plot(p1,scale = .9) # Reduzi a escala para encaixar o gráfico dentro da imagem
final

cowplot::save_plot(filename = "final.png",
                   final,base_width = 10,
                   base_height = 10/1.618) # para manter a proporção de ouro.

2 curtidas

Olá pessoal! Adorei o desafio!! :smiling_face_with_three_hearts:

Esta foi a minha solução para o desafio. Tive os mesmos problemas na importação da fonte utilizando o Windows.

library(dados)
library(tidyverse)
library(jpeg)
library(ggimage) 
library(extrafont)
library(gghighlight)

remotes::install_version("Rttf2pt1", version = "1.3.8")
extrafont::font_import()
loadfonts(device = "win")

img <- ("stw.jpg")

graph <- dados_graph |>
  ggplot() +
  geom_point(
    aes(x = massa, y = altura),
    colour = "red",
    pch = 18,
    lwd = 2.5
  ) +
  gghighlight(
    nome == "Darth Vader",
    label_key = nome,
    unhighlighted_colour = "yellow",
    label_params = list(size = 3.5,
                        face = "bold",
                        fill = "red")
  ) +
  labs(x = "Massa",
       y = "Altura") +
  theme(
    text = element_text(family = "Star Jedi"),
    plot.title = element_text(
      size = rel(2.5),
      face = "bold",
      vjust = 1.5,
      hjust = 0.5
    ),
    plot.subtitle = element_text(
      size = rel(1.5),
      vjust = 1.5,
      hjust = 0.5
    ),
    rect = element_blank(),
    panel.grid = element_blank(),
    axis.text.x = element_text(
      face = "bold",
      color = "yellow",
      family = "Star Jedi",
    ),
    axis.text.y = element_text(
      face = "bold",
      color = "yellow",
      family = "Star Jedi",
    ),
    axis.text = element_text(
      face = "bold",
      color = "yellow",
      family = "Star Jedi",
    ),
    title = element_text(color = "yellow")
  ) +
  scale_x_continuous(breaks = seq(0, 200, 50), limits = c(0, 200)) +
  labs(
    title = "STAR WARS",
    subtitle = "may the force be with you",
    caption = "Elaborado por: Ariane Hayana",
    x = "Massa",
    y = "Altura",
    fill = ""
  )
ggbackground(graph, img)

2 curtidas

Olá pessoal, tudo bem?

Adorei o desafio e me diverti bastante participando.

Fiz o gráfico em rmarkdown.

Assisto todas as lives e postagens do Curso R, vcs são os melhores.

Adoraria ganhar uma bolsa para fazer o curso de machine learning. :slight_smile:

title: “Desafio Star Wars”
author: “Ramon Roldan”
date: “4/15/2022”
output: html_document

knitr::opts_chunk$set(echo = TRUE)
library(dplyr)
library(ggplot2)
library(cowplot)
base<- dados::dados_starwars
p1<- 
  ggplot(data = base,aes(x = massa,y = altura))+
  geom_point(color='yellow',shape=18)+
  geom_point(data = base %>% filter(nome=='Darth Vader'),color= 'red',shape=18)+
  scale_x_continuous(limits = c(0,200))+
  labs(title = "STAR WARS",subtitle = "May the force be with you",x = "MASSA",y = "ALTURA")+
  ggrepel::geom_label_repel(data = base %>% filter(nome=='Darth Vader'),fill= 'red', aes(label=nome))+
  theme_cowplot()+
   theme(plot.title =  element_text(family="Star Jedi",color = 'yellow', hjust = 0.5,size = 23),
   plot.subtitle = element_text(family="Star Jedi",color = 'yellow', hjust = 0.5,size = 8.5),
   axis.title = element_text(family="Star Jedi",color = 'yellow'),
   panel.grid.major.y = element_line(color = 'grey10'),
   axis.text = element_text(color = 'yellow',face = 'bold'))
  

ggdraw() +
  draw_image(image = "https://wallpaperaccess.com/full/11836.jpg",scale = 1.25,hjust = .12) +
  draw_plot(p1)

Segue imagem de como ficou:

1 curtida

Olá, aqui está a minha resolução do desafio.

Minha maior dificuldade foi com a importação de fontes, mas depois consegui solucionar. Deixei uma fonte diferente, mas mantive todos os outros atributos do gráfico.

Obrigada por disponibilizar os desafios :wink:

1 curtida

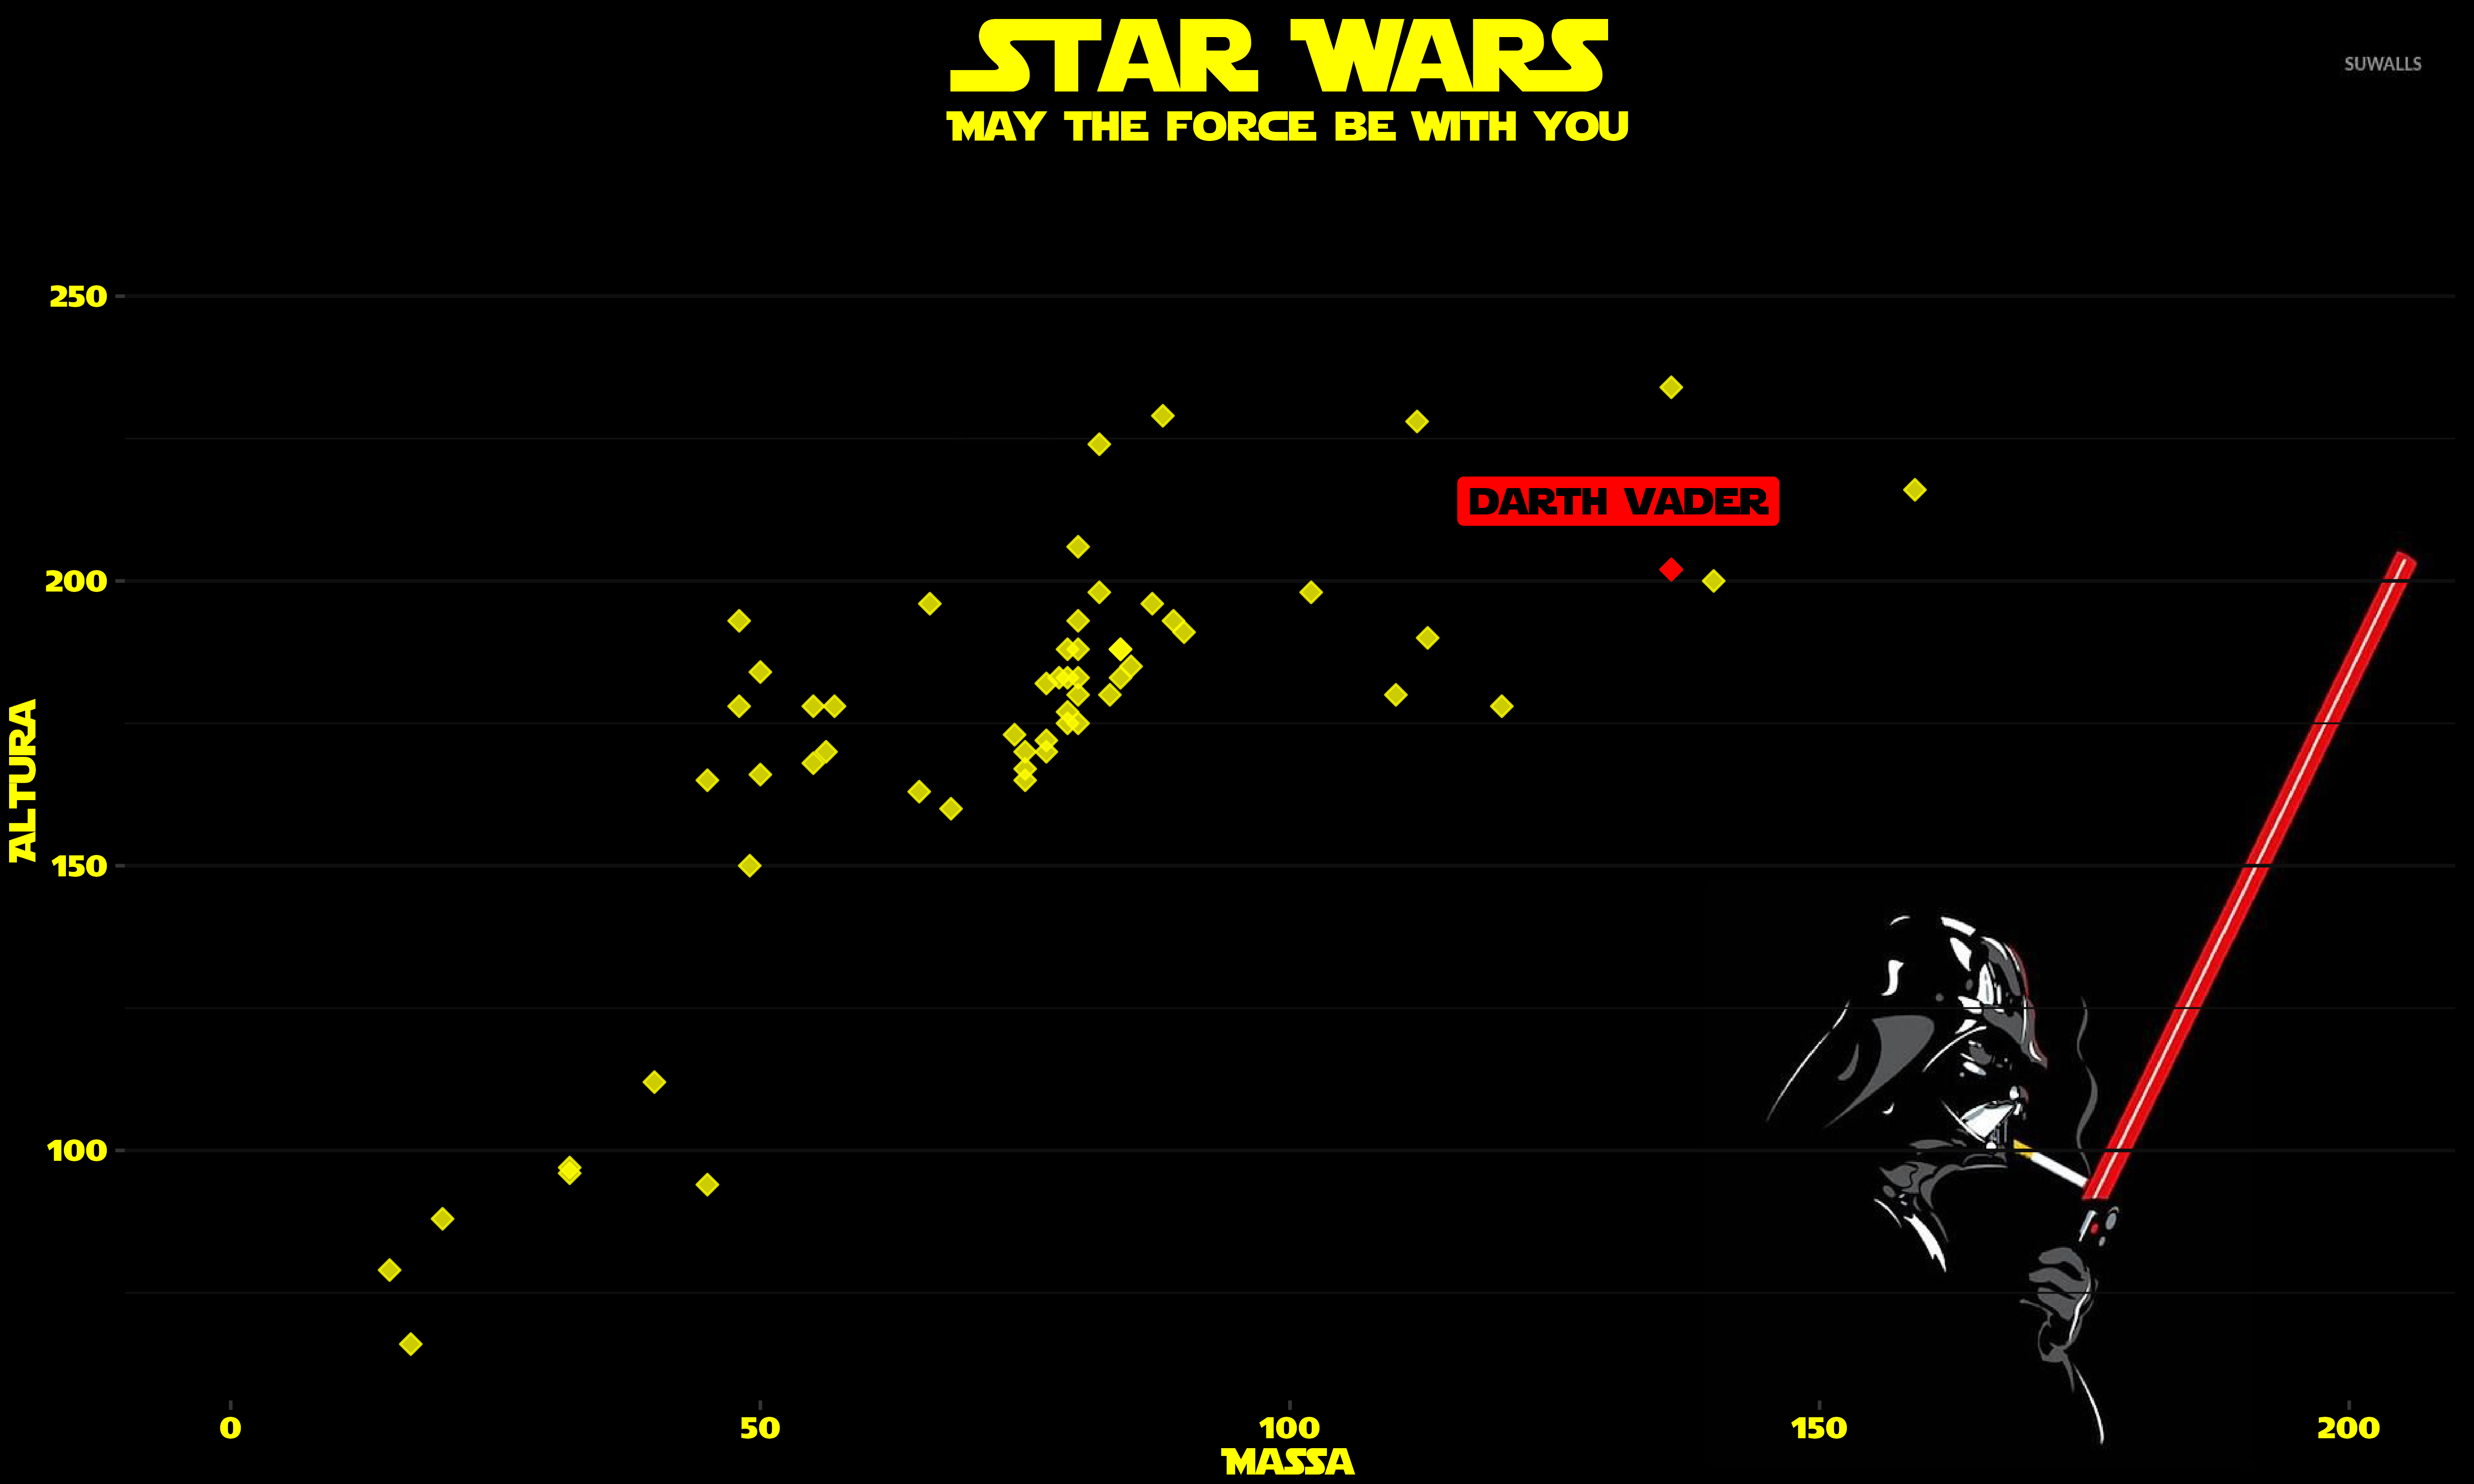
Aqui está o código usado para produzir o gráfico que fiz acima:

# Curso R -------------------------------------------------------------------------------------------------------------------------------
# Gráfico Temático Star Wars ---------------------------------------------------------------------------------------------------------------
# Desafio #3 ----------------------------------------------------------------------------------------------------------------------------------
# Autoria do script: Jeanne Franco ---------------------------------------------------------------------------------------------------------
# Data: 16/04/2022 -------------------------------------------------------------------------------------------------------------------------

# Carregar pacotes -------------------------------------------------------------------------------------------------------------------------

library(tidyverse) # Pacotes ggplot2 para o gráfico e dplyr para filtrar os dados.
library(cowplot) # Pacote para inserir imagem ao gráfico.
library(dados) # Pacote para acessar os dados.
library(showtext) # Pacote para baixar fonte das letras.

# Carregar dados ---------------------------------------------------------------------------------------------------------------------------

dados_starwars
View(dados_starwars)

# Selecionar e filtrar dados ---------------------------------------------------------------------------------------------------------------

### Identificando o outlier da massa

dados_starwars %>%
  select(nome, altura, massa) %>%
  summarise(outlier = max(massa, na.rm = TRUE))

### Excluindo o outlier

dados_starwars %>%
  select(nome, altura, massa) %>%
  filter(massa != 1358)
  
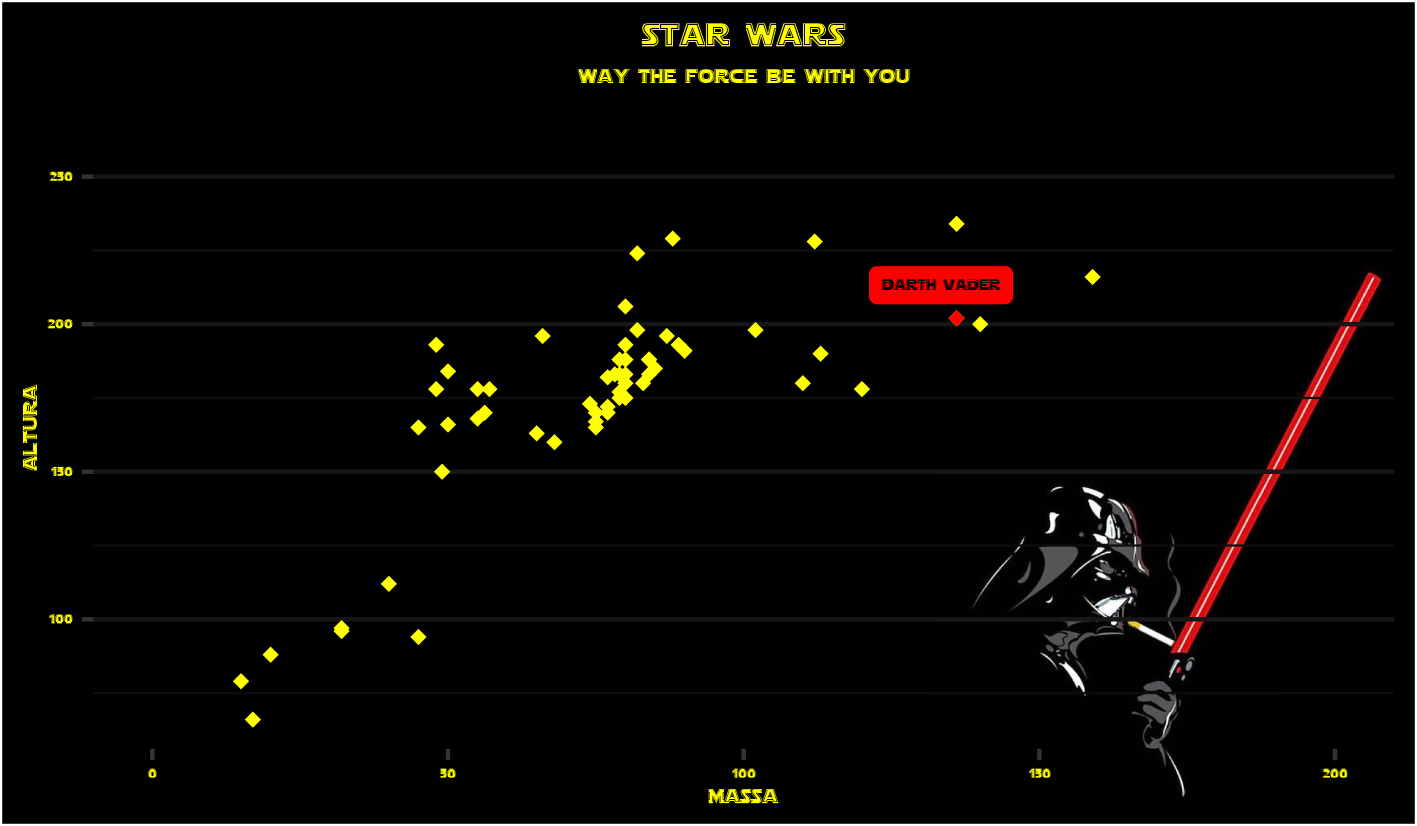
### Para saber a localização do ponto da altura e massa do Darth Vader

point_vader <- dados %>%
  filter(nome == "Darth Vader")
point_vader

# Adicionando a fonte ----------------------------------------------------------------------------------------------------------------------

### Adicionar fonte Star Wars ao sistema windows

sysfonts::font_add("Starjout", regular = "Starjout.ttf")
library(showtext) # Carregar pacote antes de gerar o gráfico
showtext_auto()
font_families() # Verificar fontes disponíveis

# Gráfico ----------------------------------------------------------------------------------------------------------------------------------

plot <- ggplot(dados_starwars) +
  geom_point(aes(x = massa, y = altura), color = "yellow", shape = 18) +
  theme(
    plot.title = element_text(hjust = 0.5, color = "yellow", family = "Starjout", size = 25),
    plot.subtitle = element_text(hjust = 0.5, color = "yellow", family = "Starjout", size = 15),
    axis.title = element_text(color = "yellow", family = "Starjout", size = 15),
    axis.text = element_text(color = "yellow", family = "Starjout"),
    panel.grid.minor.x = element_blank(),
    panel.grid.major.x = element_blank(),
    panel.grid.major.y = element_line(color = "gray9"),
    panel.grid.minor.y = element_line(color = "gray5"),
    panel.background = element_rect(fill = "transparent"),
    plot.background = element_rect(fill = "transparent")) +
    annotate(geom = "point", x = 136, y = 202, 
             color = "red", shape = 18) +
    annotate(geom = "label", x = 121, y = 213.2, 
             label = "Darth Vader", hjust = "left",
             fill = "red", color = "black", family = "Starjout") +
    scale_x_continuous(limits =  c(0, 200)) +
    labs(x = "Massa", y = "Altura", title = "Star Wars", subtitle = "Way the force be with you") 
plot

### Adicionar imagem de fundo

ggdraw() +
draw_image(halign = 1, valign = 0, width = 1, height = 1, scale = 1.1,
           image = "11836.jpg") +
  draw_plot(plot)

# Salvar gráfico ---------------------------------------------------------------------------------------------------------------------------

ggsave("plot.png", width = 12, height = 7, units = "cm")

2 curtidas