Boa tarde!
Estou tentando fazer o link de 2 inputs que serão inseridos pelo usuário a 1 output no Shiny em um gráfico de dispersão. Estou utilizando o dataset MTCARS.
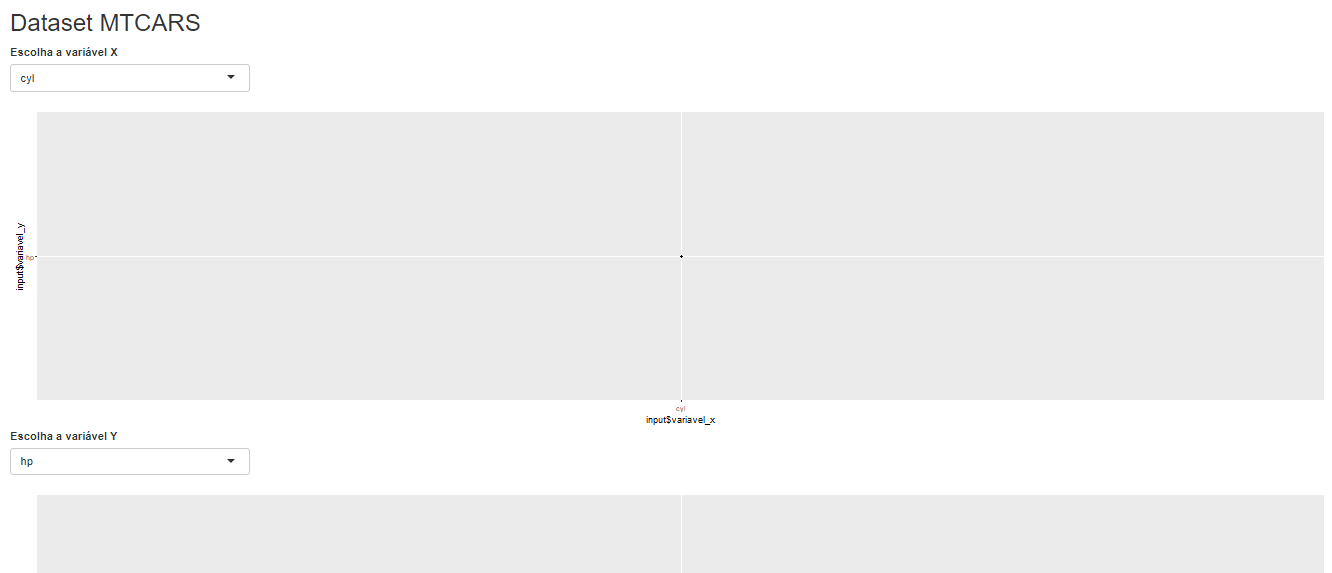
Após inserir os códigos abaixo e dar Run App, quando escolho as variáveis não “alimenta” o gráfico de dispersão.
Podem me dar um help sobre o que deixei de fora?
O app para que vejam que não teve vínculo
library(ggplot2)
library(tidyverse)
library(shiny)
ui ← fluidPage(
titlePanel(“Dataset MTCARS”),
selectInput(
inputId = “variavel_x”,
label = “Escolha a variável X”,
choices = names(mtcars)
),
plotOutput(outputId = “dispersao_x”),
selectInput(
inputId = “variavel_y”,
label = “Escolha a variável Y”,
choices = names(mtcars)
),
plotOutput(outputId = “dispersao_y”)
)
server ← function(input, output, session) {
output$dispersao_x ← renderPlot({
ggplot(mtcars) +
geom_point(mapping = aes(x = input$variavel_x, y = input$variavel_y))
})
output$dispersao_y ← renderPlot({
ggplot(mtcars) +
geom_point(mapping = aes(x = input$variavel_x, y = input$variavel_y))
})
}
shinyApp(ui, server)
_ga=2.120961352.1794586853.1633799965-1345663751.1633799965)
Boa noite, Wanelly!
Eu tive o mesmo problema quando tentei resolver esse exercício. E a sacada é exatamente o modo como chamamos os inputs dentro do gráfico. Pelo que pesquisei (deve ter outras formas, sem dúvida) o modo mais fácil de resolver isso é usando o argumento .data[[input$nome_variavel]] , assim o gráfico consegue identificar o input corretamente.
Outro detalhe é que para esse exercício você só precisa de 1 output, pois o gráfico de dispersão irá usar o input da variável x e o input da variável y.
Segue o código que você mandou porém revisado:
library(ggplot2)
library(tidyverse)
library(shiny)
#> Warning: package 'shiny' was built under R version 4.1.1

 ui <- fluidPage(

     titlePanel("Dataset MTCARS"),

     selectInput(
         inputId = "variavel_x",
         label = "Escolha a variável X",
         choices = names(mtcars)
     ),

     selectInput(
         inputId = "variavel_y",
         label = "Escolha a variável Y",
         choices = names(mtcars)
     ),

     # coloquei o output depois para fazer sentido a escolha do usuário
     plotOutput(outputId = "dispersao_x"),

     # não há necessidade desse output
     # plotOutput(outputId = "dispersao_y")

 )

 server <- function(input, output, session) {

     output$dispersao_x <- renderPlot({

        ggplot(mtcars) +
        geom_point(
            aes(
                # a mudança necessária é aqui
                x = .data[[input$variavel_x]],
                y = .data[[input$variavel_y]]

                )
        )
     })

     # não há necessidade desse output, porque o gráfico vai usar os dois inputs
     # output$dispersao_y <- renderPlot({
     #
     #     ggplot(mtcars) +
     #     geom_point(
     #         aes(x = input$variavel_x,
     #             y = input$variavel_y)
     #         )
     # })
 }

 shinyApp(ui, server)
Shiny applications not supported in static R Markdown documents
Created on 2021-10-12 by the reprex package (v2.0.0)
Espero ter ajudado!
Abraços.
1 curtida
Obrigada, Maykon! Eu desconheço essa função .data.
Rodou bonitinho aqui!