Boa noite pessoal,
Estou criando um pacote e dentro de uma função desse meu pacote estou usando uma função chamada NbClust de um pacote também chamado NbClust, que me gera um número ótimo de clusters dado o input que forneço.
O que acontece é que essa função do NbClust, apesar de eu pedir para que salve o resultado num objeto, ele gera vários gráficos e mensagens que eu gostaria que fosse omitido, pois o que eu preciso está dentro do objeto criado.
Há uma maneira que eu possa silenciar/impedir a geração desses gráficos e mensagens?
Segue um exemplo reprodutível:
df <- tibble::tribble(
  ~name,  ~axis_1,   ~axis_2,
  "A",  -154.9610, 59.47976,
  "B",  -153.3270, 61.49629,
  "C", -139.8220, 68.61097,
  "D", -138.4874, 64.09471,
  "E", -136.6808, 65.87089,
  "G",  -140.4418, 71.69671,
  "H",  -138.1343, 75.52891,
  "I",  -126.5767, 75.78709,
  "J", -125.6488, 74.20999,
  "K",  -119.1496, 72.31315,
  "AA",  -194.9610, 99.47976,
  "BB",  -183.3270, 71.49629,
  "CC", -119.8220, 58.61097,
  "DD", -128.4874, 74.09471,
  "EE", -166.6808, 66.87089,
  "GG",  -170.4418, 77.69671,
  "HH",  -168.1343, 65.52891,
  "II",  -146.5767, 85.78709,
  "JJ", -129.6488, 75.20999,
  "KK",  -129.1496, 82.31315) |>
  tibble::column_to_rownames(var = "name")

cluster_n <- NbClust::NbClust(df, diss = NULL, distance = "euclidean", min.nc = 2, max.nc = 4, method = "kmeans")
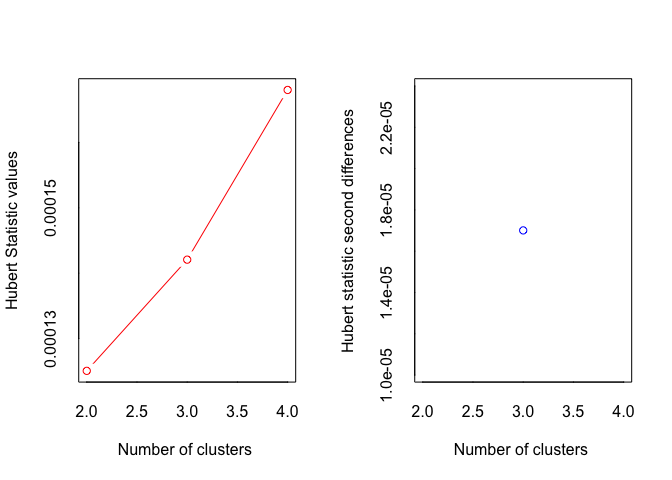
#> *** : The Hubert index is a graphical method of determining the number of clusters.
#>                 In the plot of Hubert index, we seek a significant knee that corresponds to a
#>                 significant increase of the value of the measure i.e the significant peak in Hubert
#>                 index second differences plot.
#>
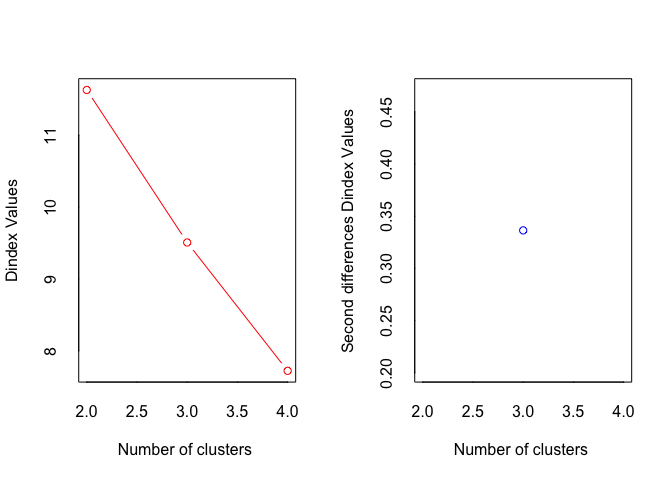
#> *** : The D index is a graphical method of determining the number of clusters.
#>                 In the plot of D index, we seek a significant knee (the significant peak in Dindex
#>                 second differences plot) that corresponds to a significant increase of the value of
#>                 the measure.
#>
#> *******************************************************************
#> * Among all indices:
#> * 13 proposed 2 as the best number of clusters
#> * 6 proposed 3 as the best number of clusters
#> * 4 proposed 4 as the best number of clusters
#>
#>                    ***** Conclusion *****
#>
#> * According to the majority rule, the best number of clusters is  2
#>
#>
#> *******************************************************************
Created on 2023-08-01 with reprex v2.0.2
Obrigada!